【SpringBoot】SpringBoot基础教程(9)
前言:
本文内容:员工管理系统:展示员工列表、增加员工信息、修改员工信息
推荐免费SpringBoot基础教程视频:【狂神说Java】SpringBoot最新教程通俗易懂_哔哩哔哩_bilibili
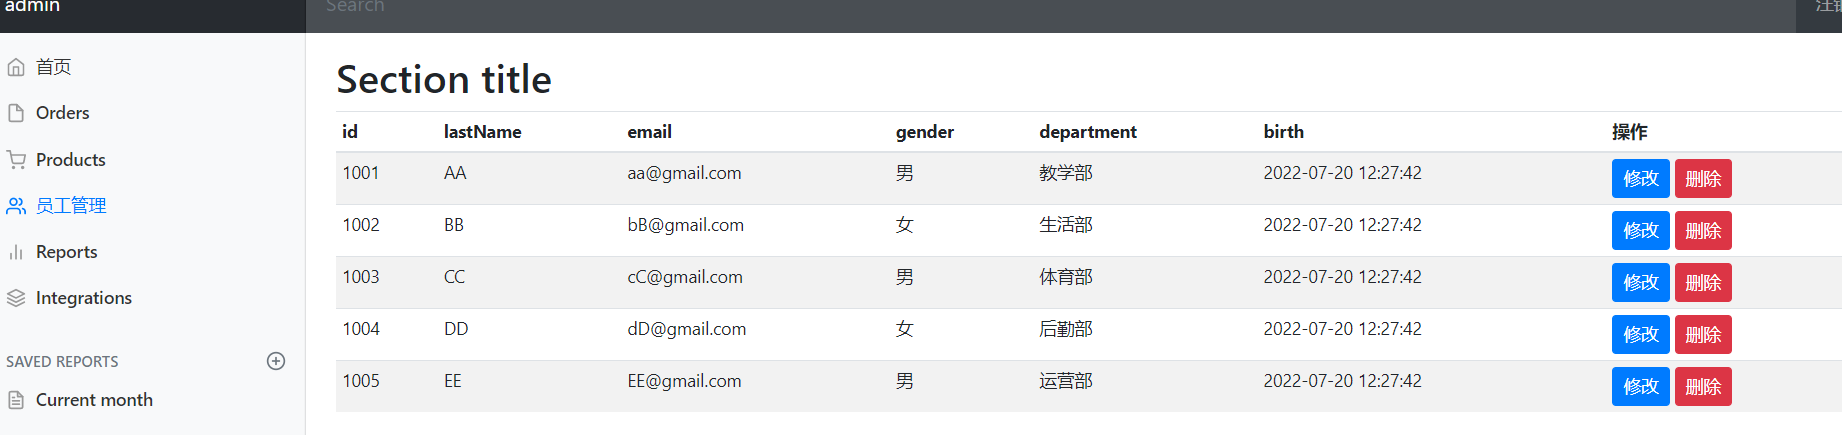
员工管理系统:展示员工列表
-
新建
EmployeeController.java,编写员工信息展示1
2
3
4
5
6
7
8
9
10
11
12
13
14
15
16
17
18
19
20
21
22
23
24
25
26
27
28
29
30package com.jokerdig.controller;
import com.jokerdig.dao.EmployeeDao;
import com.jokerdig.pojo.Employee;
import org.springframework.beans.factory.annotation.Autowired;
import org.springframework.stereotype.Controller;
import org.springframework.ui.Model;
import org.springframework.web.bind.annotation.RequestMapping;
import java.util.Collection;
/**
* @author Joker大雄
* @data 2022/7/20 - 10:18
**/
// 员工controller
public class EmployeeController {
EmployeeDao employeeDao;
// 员工展示
public String employeeList(Model model){
Collection<Employee> emList = employeeDao.getAll();
model.addAttribute("emList",emList);
return "emp/list";
}
} -
在
MyMVCConfig中的addViewControllers下注册视图1
registry.addViewController("/list.html").setViewName("emp/list");
-
在
templates下新建commons/commons.html,并提取主页面的导航栏和侧边栏1
2
3
4
5
6
7
8
9
10
11
12
13
14
15
16
17
18
19
20
21
22
23
24
25
26
27
28
29
30
31
32
33
34
35
36
37
38
39
40
41
42
43
44
45
46
47
48
49
50
51
52
53
54
55
56
57
58
59
60
61
62
63
64
65
66
67
68
69
70
71
72
73
74
75
76
77
78
79
80
81
82
83
84
85
86
87
88
89
90
91
92
93
94
95
96
97
98
99
100
101
102
103
104
105
106
107
108
109
110
111
112
113
114
115
116
117
118
119
120
121
122
123
124
125
126
127
128
129
130
131
132
133
134
135
136
137
138
139
<html lang="en" xmlns:th="http://www.thymeleaf.org">
<!--头部导航栏-->
<nav class="navbar navbar-dark sticky-top bg-dark flex-md-nowrap p-0" th:fragment="topNav">
<a class="navbar-brand col-sm-3 col-md-2 mr-0" href="http://getbootstrap.com/docs/4.0/examples/dashboard/#">[[${session.loginUser}]]</a>
<input class="form-control form-control-dark w-100" type="text" placeholder="Search" aria-label="Search">
<ul class="navbar-nav px-3">
<li class="nav-item text-nowrap">
<a class="nav-link" href="http://getbootstrap.com/docs/4.0/examples/dashboard/#">注销登录</a>
</li>
</ul>
</nav>
<!--侧边栏-->
<nav class="col-md-2 d-none d-md-block bg-light sidebar" th:fragment="siderNav">
<div class="sidebar-sticky">
<ul class="nav flex-column">
<li class="nav-item">
<a th:class="${active=='main.html'?'nav-link active':'nav-link'}" th:href="@{/index.html}">
<svg xmlns="http://www.w3.org/2000/svg" width="24" height="24" viewBox="0 0 24 24" fill="none" stroke="currentColor" stroke-width="2" stroke-linecap="round" stroke-linejoin="round" class="feather feather-home">
<path d="M3 9l9-7 9 7v11a2 2 0 0 1-2 2H5a2 2 0 0 1-2-2z"></path>
<polyline points="9 22 9 12 15 12 15 22"></polyline>
</svg>
首页 <span class="sr-only">(current)</span>
</a>
</li>
<li class="nav-item">
<a class="nav-link" href="http://getbootstrap.com/docs/4.0/examples/dashboard/#">
<svg xmlns="http://www.w3.org/2000/svg" width="24" height="24" viewBox="0 0 24 24" fill="none" stroke="currentColor" stroke-width="2" stroke-linecap="round" stroke-linejoin="round" class="feather feather-file">
<path d="M13 2H6a2 2 0 0 0-2 2v16a2 2 0 0 0 2 2h12a2 2 0 0 0 2-2V9z"></path>
<polyline points="13 2 13 9 20 9"></polyline>
</svg>
Orders
</a>
</li>
<li class="nav-item">
<a class="nav-link" href="http://getbootstrap.com/docs/4.0/examples/dashboard/#">
<svg xmlns="http://www.w3.org/2000/svg" width="24" height="24" viewBox="0 0 24 24" fill="none" stroke="currentColor" stroke-width="2" stroke-linecap="round" stroke-linejoin="round" class="feather feather-shopping-cart">
<circle cx="9" cy="21" r="1"></circle>
<circle cx="20" cy="21" r="1"></circle>
<path d="M1 1h4l2.68 13.39a2 2 0 0 0 2 1.61h9.72a2 2 0 0 0 2-1.61L23 6H6"></path>
</svg>
Products
</a>
</li>
<li class="nav-item">
<a th:class="${active=='list.html'?'nav-link active':'nav-link'}" th:href="@{/emps}">
<svg xmlns="http://www.w3.org/2000/svg" width="24" height="24" viewBox="0 0 24 24" fill="none" stroke="currentColor" stroke-width="2" stroke-linecap="round" stroke-linejoin="round" class="feather feather-users">
<path d="M17 21v-2a4 4 0 0 0-4-4H5a4 4 0 0 0-4 4v2"></path>
<circle cx="9" cy="7" r="4"></circle>
<path d="M23 21v-2a4 4 0 0 0-3-3.87"></path>
<path d="M16 3.13a4 4 0 0 1 0 7.75"></path>
</svg>
员工管理
</a>
</li>
<li class="nav-item">
<a class="nav-link" href="http://getbootstrap.com/docs/4.0/examples/dashboard/#">
<svg xmlns="http://www.w3.org/2000/svg" width="24" height="24" viewBox="0 0 24 24" fill="none" stroke="currentColor" stroke-width="2" stroke-linecap="round" stroke-linejoin="round" class="feather feather-bar-chart-2">
<line x1="18" y1="20" x2="18" y2="10"></line>
<line x1="12" y1="20" x2="12" y2="4"></line>
<line x1="6" y1="20" x2="6" y2="14"></line>
</svg>
Reports
</a>
</li>
<li class="nav-item">
<a class="nav-link" href="http://getbootstrap.com/docs/4.0/examples/dashboard/#">
<svg xmlns="http://www.w3.org/2000/svg" width="24" height="24" viewBox="0 0 24 24" fill="none" stroke="currentColor" stroke-width="2" stroke-linecap="round" stroke-linejoin="round" class="feather feather-layers">
<polygon points="12 2 2 7 12 12 22 7 12 2"></polygon>
<polyline points="2 17 12 22 22 17"></polyline>
<polyline points="2 12 12 17 22 12"></polyline>
</svg>
Integrations
</a>
</li>
</ul>
<h6 class="sidebar-heading d-flex justify-content-between align-items-center px-3 mt-4 mb-1 text-muted">
<span>Saved reports</span>
<a class="d-flex align-items-center text-muted" href="http://getbootstrap.com/docs/4.0/examples/dashboard/#">
<svg xmlns="http://www.w3.org/2000/svg" width="24" height="24" viewBox="0 0 24 24" fill="none" stroke="currentColor" stroke-width="2" stroke-linecap="round" stroke-linejoin="round" class="feather feather-plus-circle"><circle cx="12" cy="12" r="10"></circle><line x1="12" y1="8" x2="12" y2="16"></line><line x1="8" y1="12" x2="16" y2="12"></line></svg>
</a>
</h6>
<ul class="nav flex-column mb-2">
<li class="nav-item">
<a class="nav-link" href="http://getbootstrap.com/docs/4.0/examples/dashboard/#">
<svg xmlns="http://www.w3.org/2000/svg" width="24" height="24" viewBox="0 0 24 24" fill="none" stroke="currentColor" stroke-width="2" stroke-linecap="round" stroke-linejoin="round" class="feather feather-file-text">
<path d="M14 2H6a2 2 0 0 0-2 2v16a2 2 0 0 0 2 2h12a2 2 0 0 0 2-2V8z"></path>
<polyline points="14 2 14 8 20 8"></polyline>
<line x1="16" y1="13" x2="8" y2="13"></line>
<line x1="16" y1="17" x2="8" y2="17"></line>
<polyline points="10 9 9 9 8 9"></polyline>
</svg>
Current month
</a>
</li>
<li class="nav-item">
<a class="nav-link" href="http://getbootstrap.com/docs/4.0/examples/dashboard/#">
<svg xmlns="http://www.w3.org/2000/svg" width="24" height="24" viewBox="0 0 24 24" fill="none" stroke="currentColor" stroke-width="2" stroke-linecap="round" stroke-linejoin="round" class="feather feather-file-text">
<path d="M14 2H6a2 2 0 0 0-2 2v16a2 2 0 0 0 2 2h12a2 2 0 0 0 2-2V8z"></path>
<polyline points="14 2 14 8 20 8"></polyline>
<line x1="16" y1="13" x2="8" y2="13"></line>
<line x1="16" y1="17" x2="8" y2="17"></line>
<polyline points="10 9 9 9 8 9"></polyline>
</svg>
Last quarter
</a>
</li>
<li class="nav-item">
<a class="nav-link" href="http://getbootstrap.com/docs/4.0/examples/dashboard/#">
<svg xmlns="http://www.w3.org/2000/svg" width="24" height="24" viewBox="0 0 24 24" fill="none" stroke="currentColor" stroke-width="2" stroke-linecap="round" stroke-linejoin="round" class="feather feather-file-text">
<path d="M14 2H6a2 2 0 0 0-2 2v16a2 2 0 0 0 2 2h12a2 2 0 0 0 2-2V8z"></path>
<polyline points="14 2 14 8 20 8"></polyline>
<line x1="16" y1="13" x2="8" y2="13"></line>
<line x1="16" y1="17" x2="8" y2="17"></line>
<polyline points="10 9 9 9 8 9"></polyline>
</svg>
Social engagement
</a>
</li>
<li class="nav-item">
<a class="nav-link" href="http://getbootstrap.com/docs/4.0/examples/dashboard/#">
<svg xmlns="http://www.w3.org/2000/svg" width="24" height="24" viewBox="0 0 24 24" fill="none" stroke="currentColor" stroke-width="2" stroke-linecap="round" stroke-linejoin="round" class="feather feather-file-text">
<path d="M14 2H6a2 2 0 0 0-2 2v16a2 2 0 0 0 2 2h12a2 2 0 0 0 2-2V8z"></path>
<polyline points="14 2 14 8 20 8"></polyline>
<line x1="16" y1="13" x2="8" y2="13"></line>
<line x1="16" y1="17" x2="8" y2="17"></line>
<polyline points="10 9 9 9 8 9"></polyline>
</svg>
Year-end sale
</a>
</li>
</ul>
</div>
</nav>
</html> -
修改
dashboard.html并在templates下新建emp文件夹,并将list.html修改后放入dashboard.html1
2
3
4
5
6
7
8
9
10
11
12
13
14
15
16
17
18
19
20
21
22
23
24
25
26
27
28
29
30
31
32
33
34
35
36
37
38
39
40
41
42
43
44
45
46
47
48
49
50
51
52
53
54
55
56
57
58
59
60
61
62
63
64
65
66
67
68
69
70
71
72
73
74
75
76
77
78
79
80
81
82
83
84
85
86
87
88
89
90
91
92
93
94
95
96
97
98
99
100
101
102
103
104
105
106
107
108
109
110
111
112
113
114
115
116
117
118
119
120
121
122
123
124
125
126
127
<!-- saved from url=(0052)http://getbootstrap.com/docs/4.0/examples/dashboard/ -->
<html lang="en" xmlns:th="http://www.thymeleaf.org"
xmlns:sec="http://www.thymeleaf.org/extras/spring-security"
xmlns:shiro="http://www.pollix.at/thymeleaf/shiro">
<head>
<meta http-equiv="Content-Type" content="text/html; charset=UTF-8">
<meta name="viewport" content="width=device-width, initial-scale=1, shrink-to-fit=no">
<meta name="description" content="">
<meta name="author" content="">
<title>Dashboard Template for Bootstrap</title>
<!-- Bootstrap core CSS -->
<link th:href="@{/css/bootstrap.min.css}" rel="stylesheet">
<!-- Custom styles for this template -->
<link th:href="@{/css/dashboard.css}" rel="stylesheet">
<style type="text/css">
/* Chart.js */
@-webkit-keyframes chartjs-render-animation {
from {
opacity: 0.99
}
to {
opacity: 1
}
}
@keyframes chartjs-render-animation {
from {
opacity: 0.99
}
to {
opacity: 1
}
}
.chartjs-render-monitor {
-webkit-animation: chartjs-render-animation 0.001s;
animation: chartjs-render-animation 0.001s;
}
</style>
</head>
<body>
<!-- 导航栏-->
<div th:replace="~{commons/commons::topNav}"></div>
<div class="container-fluid">
<div class="row">
<!-- 侧边栏-->
<div th:replace="~{commons/commons::siderNav(active='main.html')}"></div>
<main role="main" class="col-md-9 ml-sm-auto col-lg-10 pt-3 px-4">
<div class="chartjs-size-monitor" style="position: absolute; left: 0px; top: 0px; right: 0px; bottom: 0px; overflow: hidden; pointer-events: none; visibility: hidden; z-index: -1;">
<div class="chartjs-size-monitor-expand" style="position:absolute;left:0;top:0;right:0;bottom:0;overflow:hidden;pointer-events:none;visibility:hidden;z-index:-1;">
<div style="position:absolute;width:1000000px;height:1000000px;left:0;top:0"></div>
</div>
<div class="chartjs-size-monitor-shrink" style="position:absolute;left:0;top:0;right:0;bottom:0;overflow:hidden;pointer-events:none;visibility:hidden;z-index:-1;">
<div style="position:absolute;width:200%;height:200%;left:0; top:0"></div>
</div>
</div>
<div class="d-flex justify-content-between flex-wrap flex-md-nowrap align-items-center pb-2 mb-3 border-bottom">
<h1 class="h2">Dashboard</h1>
<div class="btn-toolbar mb-2 mb-md-0">
<div class="btn-group mr-2">
<button class="btn btn-sm btn-outline-secondary">Share</button>
<button class="btn btn-sm btn-outline-secondary">Export</button>
</div>
<button class="btn btn-sm btn-outline-secondary dropdown-toggle">
<svg xmlns="http://www.w3.org/2000/svg" width="24" height="24" viewBox="0 0 24 24" fill="none" stroke="currentColor" stroke-width="2" stroke-linecap="round" stroke-linejoin="round" class="feather feather-calendar"><rect x="3" y="4" width="18" height="18" rx="2" ry="2"></rect><line x1="16" y1="2" x2="16" y2="6"></line><line x1="8" y1="2" x2="8" y2="6"></line><line x1="3" y1="10" x2="21" y2="10"></line></svg>
This week
</button>
</div>
</div>
<canvas class="my-4 chartjs-render-monitor" id="myChart" width="1076" height="454" style="display: block; width: 1076px; height: 454px;"></canvas>
</main>
</div>
</div>
<!-- Bootstrap core JavaScript
================================================== -->
<!-- Placed at the end of the document so the pages load faster -->
<script type="text/javascript" th:src="@{/js/jquery-3.2.1.slim.min.js}" ></script>
<script type="text/javascript" th:src="@{/js/popper.min.js}"></script>
<script type="text/javascript" th:src="@{/js/bootstrap.min.js}" ></script>
<!-- Icons -->
<script type="text/javascript" th:src="@{/js/feather.min.js}" ></script>
<script>
feather.replace()
</script>
<!-- Graphs -->
<script type="text/javascript" th:src="@{/js/Chart.min.js}" ></script>
<script>
var ctx = document.getElementById("myChart");
var myChart = new Chart(ctx, {
type: 'line',
data: {
labels: ["Sunday", "Monday", "Tuesday", "Wednesday", "Thursday", "Friday", "Saturday"],
datasets: [{
data: [15339, 21345, 18483, 24003, 23489, 24092, 12034],
lineTension: 0,
backgroundColor: 'transparent',
borderColor: '#007bff',
borderWidth: 4,
pointBackgroundColor: '#007bff'
}]
},
options: {
scales: {
yAxes: [{
ticks: {
beginAtZero: false
}
}]
},
legend: {
display: false,
}
}
});
</script>
</body>
</html>list.html1
2
3
4
5
6
7
8
9
10
11
12
13
14
15
16
17
18
19
20
21
22
23
24
25
26
27
28
29
30
31
32
33
34
35
36
37
38
39
40
41
42
43
44
45
46
47
48
49
50
51
52
53
54
55
56
57
58
59
60
61
62
63
64
65
66
67
68
69
70
71
72
73
74
75
76
77
78
79
80
81
82
83
84
85
86
87
88
89
90
91
92
93
94
95
96
97
98
99
100
101
102
103
104
105
106
107
108
109
110
111
112
113
114
115
116
117
118
119
120
121
122
123
124
125
126
127
128
129
130
131
132
133
134
<!-- saved from url=(0052)http://getbootstrap.com/docs/4.0/examples/dashboard/ -->
<html lang="en" xmlns:th="http://www.thymeleaf.org"
xmlns:sec="http://www.thymeleaf.org/extras/spring-security"
xmlns:shiro="http://www.pollix.at/thymeleaf/shiro">
<head>
<meta http-equiv="Content-Type" content="text/html; charset=UTF-8">
<meta name="viewport" content="width=device-width, initial-scale=1, shrink-to-fit=no">
<meta name="description" content="">
<meta name="author" content="">
<title>Dashboard Template for Bootstrap</title>
<!-- Bootstrap core CSS -->
<link th:href="@{/css/bootstrap.min.css}" rel="stylesheet">
<!-- Custom styles for this template -->
<link th:href="@{/css/dashboard.css}" rel="stylesheet">
<style type="text/css">
/* Chart.js */
@-webkit-keyframes chartjs-render-animation {
from {
opacity: 0.99
}
to {
opacity: 1
}
}
@keyframes chartjs-render-animation {
from {
opacity: 0.99
}
to {
opacity: 1
}
}
.chartjs-render-monitor {
-webkit-animation: chartjs-render-animation 0.001s;
animation: chartjs-render-animation 0.001s;
}
</style>
</head>
<body>
<!-- 导航栏-->
<div th:replace="~{commons/commons::topNav}"></div>
<div class="container-fluid">
<div class="row">
<!-- 插入侧边栏-->
<div th:replace="~{commons/commons::siderNav(active='list.html')}"></div>
<main role="main" class="col-md-9 ml-sm-auto col-lg-10 pt-3 px-4">
<h2><a class="btn btn-sm btn-primary" th:href="@{/emp}">添加员工</a></h2>
<div class="table-responsive">
<table class="table table-striped table-sm">
<thead>
<tr>
<th>id</th>
<th>lastName</th>
<th>email</th>
<th>gender</th>
<th>department</th>
<th>birth</th>
<th>操作</th>
</tr>
</thead>
<tbody>
<tr th:each="emp:${emList}">
<td th:text="${emp.getId()}"></td>
<td th:text="${emp.getLastName()}"></td>
<td th:text="${emp.getEmail()}"></td>
<td th:text="${emp.getGender()==0? '女':'男'}"></td>
<td th:text="${emp.getDepartment().getDepartmentName()}"></td>
<td th:text="${#dates.format(emp.getBirth(),'yyyy-MM-dd HH:mm:ss')}"></td>
<td>
<a class="btn btn-sm btn-primary" th:href="@{'/emp/'+${emp.getId()}}">修改</a>
<a class="btn btn-sm btn-danger" th:href="@{'/delemp/'+${emp.getId()}}">删除</a>
</td>
</tr>
</tbody>
</table>
</div>
</main>
</div>
</div>
<!-- Bootstrap core JavaScript
================================================== -->
<!-- Placed at the end of the document so the pages load faster -->
<script type="text/javascript" th:src="@{/js/jquery-3.2.1.slim.min.js}" ></script>
<script type="text/javascript" th:src="@{/js/popper.min.js}"></script>
<script type="text/javascript" th:src="@{/js/bootstrap.min.js}" ></script>
<!-- Icons -->
<script type="text/javascript" th:src="@{/js/feather.min.js}" ></script>
<script>
feather.replace()
</script>
<!-- Graphs -->
<script type="text/javascript" src="asserts/js/Chart.min.js"></script>
<script>
var ctx = document.getElementById("myChart");
var myChart = new Chart(ctx, {
type: 'line',
data: {
labels: ["Sunday", "Monday", "Tuesday", "Wednesday", "Thursday", "Friday", "Saturday"],
datasets: [{
data: [15339, 21345, 18483, 24003, 23489, 24092, 12034],
lineTension: 0,
backgroundColor: 'transparent',
borderColor: '#007bff',
borderWidth: 4,
pointBackgroundColor: '#007bff'
}]
},
options: {
scales: {
yAxes: [{
ticks: {
beginAtZero: false
}
}]
},
legend: {
display: false,
}
}
});
</script>
</body>
</html> -
运行测试

-
展示员工列表完成
员工管理系统:增加员工信息
-
在list.html中编写添加按钮
1
2
3<main role="main" class="col-md-9 ml-sm-auto col-lg-10 pt-3 px-4">
<h2><a class="btn btn-sm btn-primary" th:href="@{/emp}">添加员工</a></h2>
<div class="table-responsive"> -
在
emp下新建add.html,并编写添加页面1
2
3
4
5
6
7
8
9
10
11
12
13
14
15
16
17
18
19
20
21
22
23
24
25
26
27
28
29
30
31
32
33
34
35
36
37
38
39
40
41
42
43
44
45
46
47
48
49
50
51
52
53
54
55
56
57
58
59
60
61
62
63
64
65
66
67
68
69
70
71
72
73
74
75
76
77
78
79
80
81
82
83
84
85
86
87
88
89
90
91
92
93
94
95
96
97
98
99
100
101
102
103
104
105
106
107
108
109
110
111
112
113
114
115
116
117
118
119
120
121
122
123
124
125
126
127
128
129
130
131
132
133
134
135
136
137
<!-- saved from url=(0052)http://getbootstrap.com/docs/4.0/examples/dashboard/ -->
<html lang="en" xmlns:th="http://www.thymeleaf.org"
xmlns:sec="http://www.thymeleaf.org/extras/spring-security"
xmlns:shiro="http://www.pollix.at/thymeleaf/shiro">
<head>
<meta http-equiv="Content-Type" content="text/html; charset=UTF-8">
<meta name="viewport" content="width=device-width, initial-scale=1, shrink-to-fit=no">
<meta name="description" content="">
<meta name="author" content="">
<title>Dashboard Template for Bootstrap</title>
<!-- Bootstrap core CSS -->
<link th:href="@{/css/bootstrap.min.css}" rel="stylesheet">
<!-- Custom styles for this template -->
<link th:href="@{/css/dashboard.css}" rel="stylesheet">
<style type="text/css">
/* Chart.js */
@-webkit-keyframes chartjs-render-animation {
from {
opacity: 0.99
}
to {
opacity: 1
}
}
@keyframes chartjs-render-animation {
from {
opacity: 0.99
}
to {
opacity: 1
}
}
.chartjs-render-monitor {
-webkit-animation: chartjs-render-animation 0.001s;
animation: chartjs-render-animation 0.001s;
}
</style>
</head>
<body>
<!-- 导航栏-->
<div th:replace="~{commons/commons::topNav}"></div>
<div class="container-fluid">
<div class="row">
<!-- 插入侧边栏-->
<div th:replace="~{commons/commons::siderNav(active='list.html')}"></div>
<main role="main" class="col-md-9 ml-sm-auto col-lg-10 pt-3 px-4">
<form th:action="@{/emp}" method="post">
<div class="form-group">
<label>LastName</label>
<input type="text" name="lastName" class="form-control" placeholder="请输入用户名">
</div>
<div class="form-group">
<label>Email</label>
<input type="email" name="email" class="form-control" placeholder="请输入邮箱">
</div>
<div class="form-group">
<label>Gender</label><br>
<div class="form-check form-check-inline">
<input class="form-check-input" type="radio" name="gender" value="1" checked>
<label class="form-check-label">男</label>
</div>
<div class="form-check form-check-inline">
<input class="form-check-input" type="radio" name="gender" value="0">
<label class="form-check-label">女</label>
</div>
</div>
<div class="form-group">
<label>Department</label>
<select class="form-control" name="department.id">
<option value="" style="display: none">请选择</option>
<option th:each="delist:${deList}" th:text="${delist.getDepartmentName()}" th:value="${delist.getId()}"></option>
</select>
</div>
<div class="form-group">
<label>Birth</label>
<input type="date" name="birth" class="form-control" placeholder="">
</div>
<button class="btn btn-primary">添加</button>
</form>
</main>
</div>
</div>
<!-- Bootstrap core JavaScript
================================================== -->
<!-- Placed at the end of the document so the pages load faster -->
<script type="text/javascript" th:src="@{/js/jquery-3.2.1.slim.min.js}" ></script>
<script type="text/javascript" th:src="@{/js/popper.min.js}"></script>
<script type="text/javascript" th:src="@{/js/bootstrap.min.js}" ></script>
<!-- Icons -->
<script type="text/javascript" th:src="@{/js/feather.min.js}" ></script>
<script>
feather.replace()
</script>
<!-- Graphs -->
<script type="text/javascript" src="asserts/js/Chart.min.js"></script>
<script>
var ctx = document.getElementById("myChart");
var myChart = new Chart(ctx, {
type: 'line',
data: {
labels: ["Sunday", "Monday", "Tuesday", "Wednesday", "Thursday", "Friday", "Saturday"],
datasets: [{
data: [15339, 21345, 18483, 24003, 23489, 24092, 12034],
lineTension: 0,
backgroundColor: 'transparent',
borderColor: '#007bff',
borderWidth: 4,
pointBackgroundColor: '#007bff'
}]
},
options: {
scales: {
yAxes: [{
ticks: {
beginAtZero: false
}
}]
},
legend: {
display: false,
}
}
});
</script>
</body>
</html> -
在EmployeeController下添加方法
1
2
3
4
5
6
7
8
9
10
11
12
13
14
15
16
17
18
19
20
21
22
23
24
25
26
27
28
29
30
31
32
33
34
35
36
37
38
39
40
41
42
43
44
45
46
47
48
49
50
51package com.jokerdig.controller;
import com.jokerdig.dao.DepartmentDao;
import com.jokerdig.dao.EmployeeDao;
import com.jokerdig.pojo.Department;
import com.jokerdig.pojo.Employee;
import org.springframework.beans.factory.annotation.Autowired;
import org.springframework.stereotype.Controller;
import org.springframework.ui.Model;
import org.springframework.web.bind.annotation.GetMapping;
import org.springframework.web.bind.annotation.PostMapping;
import org.springframework.web.bind.annotation.RequestMapping;
import java.util.Collection;
/**
* @author Joker大雄
* @data 2022/7/20 - 10:18
**/
// 员工controller
public class EmployeeController {
EmployeeDao employeeDao;
DepartmentDao departmentDao;
// 员工展示
public String employeeList(Model model){
Collection<Employee> emList = employeeDao.getAll();
model.addAttribute("emList",emList);
return "emp/list";
}
// 跳转到添加页面
public String toAddPage(Model model){
// 查询所有部门信息
Collection<Department> deList = departmentDao.getDepartments();
model.addAttribute("deList",deList);
return "emp/add";
}
// 添加员工
public String add(Employee employee){
// 添加员工
employeeDao.save(employee);
return "redirect:/emps";
}
} -
在application.properties下添加日期配置
1
2
# 配置日期格式 默认 mm/dd/yyyy
spring.mvc.format.date=yyyy-MM-dd -
运行测试,添加员工完成
员工管理系统:修改员工信息
-
在
EmployeeController中添加修改员工代码1
2
3
4
5
6
7
8
9
10
11
12
13
14
15
16
17
18// 跳转到修改页面
public String toUpdatePage( Integer id, Model model){
// id查询员工信息
Employee employee = employeeDao.getEmployeeById(id);
// 查询所有部门信息
Collection<Department> deList = departmentDao.getDepartments();
model.addAttribute("deList",deList);
model.addAttribute("emp",employee);
return "emp/update";
}
// 修改员工
public String update(Employee employee){
// 修改员工
employeeDao.save(employee);
return "redirect:/emps";
} -
在emp文件夹下新建
update.html,并编写修改页面1
2
3
4
5
6
7
8
9
10
11
12
13
14
15
16
17
18
19
20
21
22
23
24
25
26
27
28
29
30
31
32
33
34
35
36
37
38
39
40
41
42
43
44
45
46
47
48
49
50
51
52
53
54
55
56
57
58
59
60
61
62
63
64
65
66
67
68
69
70
71
72
73
74
75
76
77
78
79
80
81
82
83
84
85
86
87
88
89
90
91
92
93
94
95
96
97
98
99
100
101
102
103
104
105
106
107
108
109
110
111
112
113
114
115
116
117
118
119
120
121
122
123
124
125
126
127
128
129
130
131
132
133
134
135
136
137
138
<!-- saved from url=(0052)http://getbootstrap.com/docs/4.0/examples/dashboard/ -->
<html lang="en" xmlns:th="http://www.thymeleaf.org"
xmlns:sec="http://www.thymeleaf.org/extras/spring-security"
xmlns:shiro="http://www.pollix.at/thymeleaf/shiro">
<head>
<meta http-equiv="Content-Type" content="text/html; charset=UTF-8">
<meta name="viewport" content="width=device-width, initial-scale=1, shrink-to-fit=no">
<meta name="description" content="">
<meta name="author" content="">
<title>Dashboard Template for Bootstrap</title>
<!-- Bootstrap core CSS -->
<link th:href="@{/css/bootstrap.min.css}" rel="stylesheet">
<!-- Custom styles for this template -->
<link th:href="@{/css/dashboard.css}" rel="stylesheet">
<style type="text/css">
/* Chart.js */
@-webkit-keyframes chartjs-render-animation {
from {
opacity: 0.99
}
to {
opacity: 1
}
}
@keyframes chartjs-render-animation {
from {
opacity: 0.99
}
to {
opacity: 1
}
}
.chartjs-render-monitor {
-webkit-animation: chartjs-render-animation 0.001s;
animation: chartjs-render-animation 0.001s;
}
</style>
</head>
<body>
<!-- 导航栏-->
<div th:replace="~{commons/commons::topNav}"></div>
<div class="container-fluid">
<div class="row">
<!-- 插入侧边栏-->
<div th:replace="~{commons/commons::siderNav(active='list.html')}"></div>
<main role="main" class="col-md-9 ml-sm-auto col-lg-10 pt-3 px-4">
<form th:action="@{/empUpdate}" method="post">
<input type="hidden" name="id" th:value="${id}">
<div class="form-group">
<label>LastName</label>
<input type="text" name="lastName" class="form-control" th:value="${emp.getLastName()}" placeholder="请输入用户名" >
</div>
<div class="form-group">
<label>Email</label>
<input type="email" name="email" class="form-control" th:value="${emp.getEmail()}" placeholder="请输入邮箱">
</div>
<div class="form-group">
<label>Gender</label><br>
<div class="form-check form-check-inline">
<input class="form-check-input" type="radio" name="gender" value="1" th:checked="${emp.getGender()==1}">
<label class="form-check-label">男</label>
</div>
<div class="form-check form-check-inline">
<input class="form-check-input" type="radio" name="gender" value="0" th:checked="${emp.getGender()==0}">
<label class="form-check-label">女</label>
</div>
</div>
<div class="form-group">
<label>Department</label>
<select class="form-control" name="department.id">
<option th:value="${emp.getDepartment().getId()}" style="display: none" th:text="${emp.getDepartment().getDepartmentName()}"></option>
<option th:each="delist:${deList}" th:text="${delist.getDepartmentName()}" th:value="${delist.getId()}"></option>
</select>
</div>
<div class="form-group">
<label>Birth</label>
<input type="text" name="birth" class="form-control" th:value="${#dates.format(emp.getBirth(),'yyyy-MM-dd')}" placeholder="">
</div>
<button class="btn btn-primary">修改</button>
</form>
</main>
</div>
</div>
<!-- Bootstrap core JavaScript
================================================== -->
<!-- Placed at the end of the document so the pages load faster -->
<script type="text/javascript" th:src="@{/js/jquery-3.2.1.slim.min.js}" ></script>
<script type="text/javascript" th:src="@{/js/popper.min.js}"></script>
<script type="text/javascript" th:src="@{/js/bootstrap.min.js}" ></script>
<!-- Icons -->
<script type="text/javascript" th:src="@{/js/feather.min.js}" ></script>
<script>
feather.replace()
</script>
<!-- Graphs -->
<script type="text/javascript" src="asserts/js/Chart.min.js"></script>
<script>
var ctx = document.getElementById("myChart");
var myChart = new Chart(ctx, {
type: 'line',
data: {
labels: ["Sunday", "Monday", "Tuesday", "Wednesday", "Thursday", "Friday", "Saturday"],
datasets: [{
data: [15339, 21345, 18483, 24003, 23489, 24092, 12034],
lineTension: 0,
backgroundColor: 'transparent',
borderColor: '#007bff',
borderWidth: 4,
pointBackgroundColor: '#007bff'
}]
},
options: {
scales: {
yAxes: [{
ticks: {
beginAtZero: false
}
}]
},
legend: {
display: false,
}
}
});
</script>
</body>
</html> -
运行测试,修改功能完成
本博客所有文章除特别声明外,均采用 CC BY-NC-SA 4.0 许可协议。转载请注明来自 Hey,Joker!
- 微信
- 支付宝


相关推荐

评论
ValineTwikoo